
|
Investigating Geometric Data with Sound |

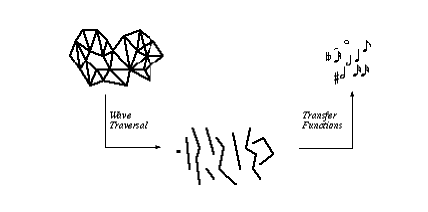
IntroductionThis paper describes our work in the interdisciplinary areas of computational topology and data sonification. The goal of our ongoing research is to discover new methods for "visualizing" large structures and higher dimensional structures—data that is difficult or impossible to render with standard methods. To this end we are researching ways to use audio to replace or supplement graphics. Both n-dimensional data sets (n > 3) and very large 3-dimensional data sets suffer in obvious ways from mappings to graphical domains; audio domains, on the other hand, are dimension-free and have the potential to portray very complex data. Applications for this work are found in computational biology, physics, theory of computation, and other areas, including music composition.Unfortunately, we are not used to "seeing" with our ears. Music is used as a narrative construct, but only with the accompaniment of the composer's notes does the story have any hope of being interpreted by the listener (Kivy, 1991). A more obvious device is the mimicking of familiar sounds with music; however, this is a mapping from one audio domain into another, a far more intuitive idea than mapping from a visual domain or an abstract narrative domain into the audio domain. Realistically, the use of audio for viewing complex data will require much research to find ‘intuitive’ maps, and it will require a training period for the listener. Still, we maintain that audio has the potential for data representation in ways yet unimagined. Our primary approach to viewing is to attempt a representation of the topological structure or connectivity of the data, that is, the number and types of holes in an object. This gives the observer a global idea of the structure of the data. Some details of the geometry are also mapped to the audio domain, providing the viewer a finer-grained image, should she desire. The data consist of simplicial complexes (triangulations) which discretize smooth objects while retaining their topological properties. We use a composite of maps to produce sound from the data. First we apply a map that we call wave traversal and then we apply transfer functions. In (Axen and Choi, 1995), we introduced wave traversal and gave details of a specific transfer function. In this study, we limit ourselves to a brief review of wave traversal, then discuss transfer functions more generally.
 Figure 1. A composite of maps produces output from data.
Wave TraversalWave traversal resembles the propagation of a wave through a medium. Formally, we map the data to a sequence of subsets using a breadth-first search, assigning simplices to subsets (called waves) according to their distance from a start vertex. As a result, the static object acquires a dynamic quality necessary for subsequent mapping to the audio domain.Wave traversal was developed initially because of this dynamic potential; however, the process has proven useful in its own right for analyzing the global topology of an object. As the waves progress, they split into multiple components and recombine as they travel around obstructions such as holes. These events—waves splitting, combining, and disappearing—signal global topological properties of the data. Transfer FunctionsWe call the mappings from waves to the audio domain transfer functions. Our goal is to produce audio output that—in microscopic as well as macroscopic structure—bears a morphological relationship to the geometry. Because the sound is composed entirely from the geometry, the listener can interpret information at many levels. We would like to achieve an intuitive map for the global structure, and content ourselves with a user-training period for interpretation of the details. In this way we find a compromise between simple maps that convey a coarse level of information, and complex maps that can confuse a novice user.Most intuitive is a map that marks an event with a specific audio signal. The recombining of wave components at a wave step indicates a tunnel (or hole) has been found, so this is handled aurally as a special signal. In our current implementation, at each step where a tunnel appears, the number of tunnels encountered up to that point is represented by a repeated ringing tone that peals the number of tunnels, beginning with a density of sound corresponding to the number of tunnels and attenuating with each peal of the signal. The tunnel signal is an irregular marker that lends some larger formal structure to the listening experience. Another event that occurs is waves splitting. This does not indicate the presence of an obstruction, but only the possibility of one (if the waves later recombine), or that the object has an interesting geometric shape. Therefore, we would map this event to some global indicator, but not to something as discrete as in the previous case. Currently, if the wave splits into multiple components, we let the complexity of the tone increase with respect to the number of components (up to 20). We describe complexity in terms of brightness and ratios among partials that make up the tone. Another type of global map that we apply is timescaling. We provide an auditory zoom corresponding to the user's visual position with respect to the complex. When a user is distant we map many data values to one sound, that can consist of a short display tone indicating something about the topology of the object. As the user approaches, a more complex sonification is engaged. If we zoom-in until we are inside the object we add sonification of the waves on each wave (i.e., we recurse). As we zoom-in, we make the transition from a many-to-one mapping to a one-to-many mapping (Axen et al., 1995). At a local level, we map each wave to a musical phrase. We choose to represent wave components in terms of pitch intervals, which require relative sound comparisons rather than identification of absolute pitch values. The first wave is mapped to a simple tone. At each wave step having multiple components, we use pitch to describe the relative size of components. The total number of vertices in a wave step is equal to one octave. According to this scale, we assign pitched tones within the octave the largest and smallest components. We average the size of the remaining components to a third pitch positioned between the others, indicating the relative distribution of vertices. At each wave step the quantitative meaning of the octave changes with the total number of vertices, but the pitch interval reflects distribution of vertices and relative sizes of components. Rescaling the octave at each wave step calibrates the meaning of the intervals from one step to the next. We impose phrasing on the tones by playing new tones at each wave step while smoothly attenuating the previous tones. These onsets correspond to the visual display of each wave step. The change of three pitches at each step evokes the voice-leading of chord transitions in classical musical counterpoint. The waves at the recursive level (when we zoom-in) are represented in rapid rhythms that are chosen according to the wave size. The correspondence between size and rhythm is arbitrary but consistent. Pitch is chosen using the same method as above, and presented in a higher octave, using bell-like percussive sounds with rapid decay. SystemWe implemented our software on the SGI platform, using the CAVE™ Automated Virtual Environment, an SGI Indigo for sound rendering, and the SGI Power Challenge for wave computation. To facilitate experimentation and music composition, we are developing a visual and audio tool on the SGI workstation that gives us the capability to easily modify transfer functions and input data.The audio rendering software we use is vss (vanilla sound server), developed by the Audio Development Group at NCSA. This object-oriented system operates on the client-server paradigm. Some architecture details are presented in (Barger, Choi, Das, and Goudeseune, 1994; Das, DeFanti, and Sandin, 1995). The software accepts control messages from the client, then does all the low-level rendering of sound—from algorithmic synthesis to scheduling on the SGI hardware. Both synthesis and control objects are available in the client interface.
ConclusionWave traversal of geometric data provides us with some topological information, while mapping to audio via transfer functions enhances and expands the analysis. Our goals include not only topological analysis, but also a stimulating auditory environment.
ReferencesAxen, U. & Choi, I. (1995). Using Additive Sound Synthesis to Analyze Simplicial Complexes. In G. Kramer & S. Smith (Eds.), Proceedings of the Second International Conference on Auditory Display, ICAD '94 (pp. 31-43). Santa Fe Institute.Kivy, P. (1991). Sound and Semblance. Cornell University Press.
Authors
|
