|
|
loudSPIRE, an Auditory Display Schema for the SPIRE System |

Abstract: SPIRE is a system for visualizing large amounts of document-based information. Auditory display was
identified as a way to supplement SPIRE’s existing visual interface; however, the diversity of data did not lend itself
to a single sonification method. Researchers at the Pacific Northwest National Laboratory developed a schema that
organizes the auditory display into layers so that multiple sonification methods can be used without sacrificing
intuitiveness and usability. This paper describes the design motivations underlying the schema, gives examples of
constituent data-to-sound mappings, and describes a prototype implementation named "loudSPIRE." Keywords:
auditory display, information visualization, document analysis, sonification, multimedia
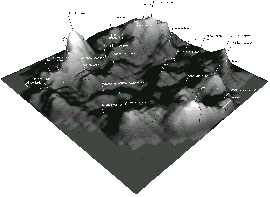
Background: The System, the Data and the ChallengeSPIRE (Spatial Paradigm for Information Retrieval and Exploration),(Wise, 1995) is a system for analyzing the information contained within large numbers of documents, using the twin visual paradigms of a galaxy and Themescape. In SPIRE, the semantic content of each document is represented as a vector of component themes--a statistical measure of key words computed from the text. Documents are placed so that those with similar theme vectors (corresponding to similar content) appear close together, while those with disparate themes fall further apart. When each document is represented as a point, a database appears on the screen as a galaxy of stars (the Galaxies visualization, Figure 1).
Figure 1
Even with careful interface design, SPIRE is a complex system with many interface elements. The amount of information that an analyst might need is sometimes simply greater than the visual interface can handle without sacrificing intuitiveness and simplicity. Graphical tactics such as iconifying, windowing and magnifying expand the interface beyond the physical screen but increase both the number of actions the user must learn in order to uncover information and the amount of attention the user must divert from analysis to interface management.(Henderson, 1986)
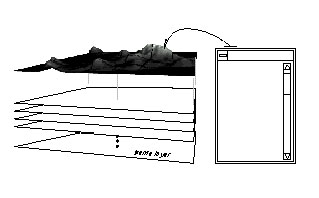
Figure 2
Figure 3 Auditory display (AD) has the potential to break through the barriers of a purely visual display. Certain unique properties of the auditory perceptual system are well-suited to the challenges found in SPIRE, and can actually make audio the more suitable form of display for some tasks. Unfortunately, the difficulty with using AD as it exists today is a lack of guidelines and culturally understood metaphors to assist the designer. Nevertheless, the application of audio to SPIRE promises many advantages, most prominently parallel listening, eyes-free listening, high dimensionality (e.g., pitch, volume, timbre, rhythm), superior temporal resolution, enhanced experience, and synesthetic feedback. (Bly, 1982; Gaver, 1991; Handel, 1989 & Kramer, 1994a) With this in mind, we targeted a list of SPIRE interface challenges to which we might successfully apply AD (Table 1).
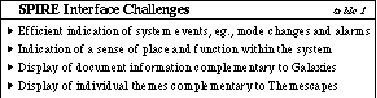
Table 1 The Approach: An Auditory Display SchemaThe core of any representation is the relationship of the information to the display. To address the targeted challenges, we began by attempting to devise data-to-sound mappings for the information involved. A survey of the literature revealed a wide range of approaches: sonification, earcons, auditory icons, audification, tonal music, "real-world" sounds, speech, parameterization, and piggy-backing variables (see Kramer, 1994a for a summary). Conceptually, sonification schemes have been categorized along continuums such as analogic / symbolic,(Kramer, 1994a & Blattner, Papp & Glinert, 1994) direct (audification) / indirect (sonification with a virtual engine), (Kramer, 1994b & Scarletti, 1994) synthetic/analogic, (Williams, 1994) signal/event,(Scarletti, 1994) and listening to a sound/listening to an object or event.(Gaver, 1994; Handel, 1989 & Blattner et al., 1994).Although each of these approaches presented strengths in certain domains, no one offered a complete solution for our list. The diverse kinds of SPIRE information appeared to require employment of several different display strategies. In addition, our intuition was that a multifaceted approach, if carefully executed, would supply an interface environment more comparable to our ‘natural’ acoustic ecology in terms of complexity and balance. (Gaver, 1994 & Blattner, 1994) The application of AD to SPIRE required that we develop a unified plan for composing the approaches most appropriate for the display of each kind of information. This schema organizes sound at all levels of the interface (a summary is given in Table 2). To construct the schema, the SPIRE interface is organized into three categories of information: system, objects, and domain attributes. Each kind of information inhabits a unique layer in the schema which 1) acts in parallel with other layers, 2) expresses itself based upon user mode and action, and 3) uses a distinct sonification method, producing a characteristic kind of sound from the user’s point of view. The kind of sounds a layer produces are chosen to associate metaphorically with the kind of data being displayed and to harmonize with sounds from other layers.
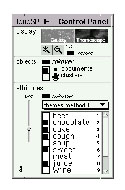
Layer 1: SystemThis layer indicates information and events that contribute to the user’s sense of being within and acting on the system. Alarms, mode changes, and operations on a system-wide object (e.g., the database under analysis) belong in this layer, where they are assigned sounds associated with the idea of a "computer system," "environment," or "icon" (in the sense that symbolic icons are used in a graphical interface). Examples of the system layer sounds are: a user-input error (a very "computer-sounding" beep), using the magnification tool ("swish"/"swoosh" for zoom in/out), and switching visualizations (short music clips with voice-over) [tracks 1, 2, 3]. The primary objectives of AD on this layer are to provide eyes- free display of system activity, and synesthetic reinforcement of user actions.Layer 2: ObjectsLayer 2 displays "tangible" data entities with distinct boundaries and properties, e.g., a document. The current SPIRE interface can display only a few properties of a document, so the AD complements the visual by sonifying data that would otherwise be accessible only by invoking another window. A partial list of document attributes is given in Figure 1.Because each SPIRE document ultimately derives from a physical record (paper, audio tape, video, etc.), the objects layer uses a parameterized auditory icon11 to represent document characteristics by making sounds associated with the original physical object. For example, when in browse mode, users are simply scanning the screen, passing their cursor over document points. As they do, they hear the sound of that document being "touched," e.g., a tap on a book [track 4]. Clicking to find out more information, they receive the full auditory icon (the sound of a book’s pages being ruffled) indicating the media type (text) and size (about 40 pages) [track 5]. Other examples include a long audio document and a short video clip [tracks 6, 7]. Layer 3: Domain AttributesA domain attribute does not reflect a property of a single object in the same way that document length or media type does. A domain attribute is an abstraction, derived from a collection of objects, which varies continuously across the document space. Each theme, the SPIRE domain attribute we targeted, is interpolated from documents across the entire galaxy. At any point one may want to display the strengths of several themes at the same time (to determine the thematic character of a region, or compare with another region) so each theme must be easily discernible but perceptually unbiased. The kind of sound should associate well with the idea of a "word" or "language" (in general), and be able to be played continuously without being annoying.The paradigm chosen to represent themes is that of a stringed orchestra playing theme data as if it were a musical score. Each theme is assigned a unique pitch [3] and an instrument. When a theme is played, the emphasis of that note indicates the strength of the theme. Note that musical emphasis can be reflected in volume, vibrato, staccato, etc., but expressly indicates "more" and "stronger." (Kramer, 1994a) Once again, the actual sound produced depends upon the user’s mode and action. For example, as users roll their cursor around a region of the screen, they can hear the waxing and waning of a single theme, or of multiple themes simultaneously sonified [tracks 8, 9]. By tuning in to a particular pitch, users can hear the strength of a theme rise and fall in relation to other themes across the Themescape. Together, these three schema layers act in concert to convey a rich display of information to the user. Layers may be active simultaneously, yet the kind of each layer’s sound distinguishes it from the others. Our auditory system’s capacities for parallel listening and auditory streaming naturally group and associate events so that instead of a muddied mix of sound we hear distinct auditory events happening within a well-contrived context. (Handel, 1989; Kramer, 1994b; Scarletti, 1994 & Bregman, 1990). The Prototype: loudSPIRETo illustrate how this works, we will describe loudSPIRE, a prototype interface based on the AD schema described above. loudSPIRE was built on a Macintosh computer in Macromedia Director, using a MIDI synthesizer to generate sounds. Using loudSPIRE, a user can explore real SPIRE data sets in a rich multimedia environment that complements the Themescape and Galaxy visualizations with AD. The crucial component of this interface is a control panel that doubles as a cross-modal legend (Figure 4). Selecting an item in the legend with the mouse or keyboard plays a representative sound, enabling the user to correlate what they are hearing with the visual icon and name for that item.
Figure 4 A typical interaction with loudSPIRE is given in audio track 10. After loading in a database, the user hears feedback indicating their visualization mode (system layer). Since all themes are initially deactivated, at first only soft taps (object layer) are heard as the cursor brushes over individual documents. In Themescapes, documents are not displayed visually, so the audio is the only indication that they are passing over a document point, which can be clicked on to hear its characteristic auditory icon. Turning on a single theme (attributes layer), the user hears regions of the Themescape that are strong and weak in that theme. Activating multiple themes prompts the discovery of similar sounds indicating related topics in different regions of the Themescape. Upon finding a region with the right thematic mix, the user polls nearby documents for size and media. Meanwhile, several additions have been made to the database, heard as small objects being dropped into a pool. ConclusionsAlthough this schema awaits formal user testing, preliminary feedback has indicated that the segregation of events into kinds of sounds works well. Users can easily distinguish between the display of a document versus a theme or a system event, and the juxtaposition of multiple AD approaches does create a sense of balance and complexity which single-approach systems sometimes miss. Some users have expressed that the sounds used to display themes were actually pleasant (which we attribute to the use of a more complex, "natural" waveform), although it is obvious that individual approaches within each layer need refinement.From a design perspective, the construction of paper prototypes and audio mock-ups (by hand-playing data into an analog 4-track recorder) enabled us to consider aesthetic and usability issues well before implementation. The process of constructing the schema itself proved valuable in refining our data model, which was modified to include the possibility of interpolating any document attribute across the screen. Our experience with this schema directs future research toward the semantics associated with kinds of sounds, interdependencies between layers, and considerations of multi-layer listening. (Kramer, 1994b) ReferencesWise, J., Thomas, J., Pennock, K., Lantrip, D., Pottier, M., Schur, A. & Crow, V. (1995, October 30-31). Visualizing the Non-Visual: Spatial analysis and interaction with information from text documents. In Proceedings of the IEEE 1995 Symposium on Information Visualization (pp. 51-58). Held in Atlanta, GA, Oct. 30-31, 1995.
Bregman, A. S. (1990). Auditory Scene Analysis: The Perceptual Organization of Sound. Cambridge, MA:
MIT Press.
Track 2. Zooming in and zooming out.
Track 3. Switching to the Galaxy visualization.
The next four tracks demonstrate sounds the user might hear from the objects layer. Auditory icons
represent documents of differing size and media type.
Track 4. The user is brushing their cursor over documents of various size and type.
Track 5. Clicking on a document point invokes a more detailed auditory icon. This one
represents an average length text document.
Track 6. An audio document, followed by the sound of a longer audio document.
Track 7. A video document, followed by a short video document.
The next two tracks are sounds from the domain attributes layer. The attribute displayed here is the
thematic content of the database, as represented by component themes:
Track 8. The sonification of a single theme as the user rolls their cursor around the screen.
W. Michelle Harris |
|||||||||||||||||