
|
TaDa! Demonstrations of Auditory Information Design |

|
|
Abstract: The prospect of computer applications making "noises" is disconcerting to some. Yet the soundscape of the real world does not usually bother us. Perhaps we only notice a nuisance? Sounds can support information-processing activities by providing information that is useful and relevant. The TaDa method focuses on designing an auditory representation to meet information requirements, so that the sounds are information rather than "noise." The design process integrates task analysis, a database of sound examples, a rule-based design aid, and interactive sound design tools. The method and tools are demonstrated in scenarios from mining exploration, resource management, and climatology. The multimedia interfaces that were implemented show that sounds can provide information that is difficult to obtain visually, and can improve the directness and usefulness of an information display. Keywords: Auditory display, information design, sound design, task analysis, computer-aided design.
IntroductionDifferent information is useful in different tasks, and different information is heard in different sounds. Scaletti defines sonification as "a mapping of numerically represented relations in some domain being studied to relations in an acoustic domain for the purpose of interpreting, understanding, or communicating relations in the domain under study" (Scaletti, 1994). The importance of the mapping of numeric to acoustic is noted by Kramer, who comments that the display should be structured to reflect structure in the data (Kramer, 1994). Similarly, Kendall points out that categorical distinctions should be heard as categorical, and steps along a continuum should be heard as such (Kendall, 1991). The importance of the domain being studied is raised by Frysinger's proposal of a taxonomy of data types and analysis tasks as a method for auditory design (Frysinger, 1990). A prototype of a task and data oriented auditory design method is found in Hayward's characterization of signals and applications for seismic analysis (Hayward, 1994).
The TaDa MethodTaDa stands for a Task-oriented Data-sensitive method for auditory information design. The method has four phases:
Computer-aided design tools have been built to support the TaDa method through
Once a high level scheme has been developed, the rule-base is used to look-up a principled mapping of information relations to acoustic relations. A taxonomy of mappings has been generalized from the literature of psychoacoustics and data visualization. These mappings can improve the veridical perception of information in an auditory representation (Barrass, 1996a). A similar rule-base has been developed for color visualization (Rogowitz et al., 1993). Once the representation has been perceptually organized, the designer may listen and make refinements with the Personify tool. The dynamic range and relationships between elements can be directly manipulated by dragging a graphic selection widget over a visualization of the display gamut. Rapid iteration is supported by immediate feedback of the sounds (Barrass 1995). The realization of the design requires sounds to be produced on a display device. Displays have different control parameters and output characteristics. A model of a display can be built from measurements of these characteristics. This model allows the sound specifications to be reproduced on different displays. Again, this is similar to an approach taken to color reproduction in visualization (Robertson et al., 1994).
Demonstration Scenarios
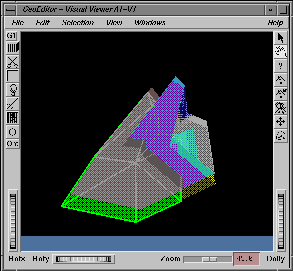
How and why one would want to use artificial sounds to support abstract activities in virtual environments is a stretch of the imagination, especially to those accustomed to working with purely graphical interfaces. The following three scenarios describe activities where there is some difficulty with the visual display and demonstrate the design of useful and relevant sounds. Mining ExplorationThe GeoViewer provides a 3D interactive view of rock strata, for mine planning and other geological applications. The user can position the viewpoint anywhere in the space and see rock layers as graphical objects. Color and texture show the material of the rock layers, and a mouse click will pop-up a text box describing the material at a point. Hidden structure can be seen through transparent surfaces, and wire-frame views speed up interactive changes in the viewpoint. However, it can be difficult to see the identity of the rock layers in the various visual modes, and pop-up text obstructs the view.
The question "what type of rock is this?" has four nominal answers: granite, limestone, shale, and marble. This information is local to a point, and absolute identification enables attention to remain on the task, without a switch to a reference. The TaDa requirements were used to look-up everyday examples with similar task and data structure from the EarBenders database. The three best matches were shaking cereal containers to determine the contents, kicking garbage bags at a recycling depot to sort them, and listening to the weather outside the tent to decide whether to sleep-in. If the semantics of the sound design are not obvious, then one of these examples may suggest a suitable everyday scheme. Otherwise it may be necessary to fall back on an "abstract" scheme of musical instrument timbres. The examples also provide auditory structure which may be analyzed for regularities that may inform the sound design. Perceptual aspects that are common to all the examples, such as {Sound Type = categorical}, were copied straight into the sound design, and are shown with an asterisk in Table 1.
The rule-base suggests that perceptually-equally-different timbres can represent categorical information because they do not imply a spurious ordering of the elements. Personify was used to choose four equally different timbres. The display device is a palette of musical instrument samples played on a Sun workstation. Each rock was arbitrarily assigned an instrument timbre at constant pitch and brightness: granite = cello, limestone = tenor sax, shale = English horn, marble = trombone. The GeoViewer plays a one-second sample of an identifying timbre when the user taps on a rock with the mouse. A rock strata that is difficult to visually identify can be heard, without having to divert visual attention to a text. An unexpected advantage became apparent when the interface was used. The sounds allow the front-most surface at an intersection of strata to be disambiguated by tapping there, saving on a distracting and computationally expensive change of viewpoint operation. A development could provide information about the number and material of overlapping hidden layers.
Resource PlanningRemote-sensed satellite data can be used to answer questions about urban development, resource management and environmental monitoring. Satellite images show change in land cover by color variations, where gray = no change, red = seasonal loss, blue = seasonal increase, darker = land cover loss, and lighter = land cover increase (Graetz et al., 1992). New suburbs where houses replace grassland appear dark red, and while areas of native forest regrowth in abandoned pastures appear light blue. These images show overall and intermediate levels of information, but the color of a single pixel, or highly variegated region, may be difficult to perceive because high spatial frequencies in hue can exceed the resolving capability of the eye (Rogowitz et al., 1993).
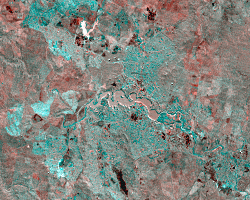
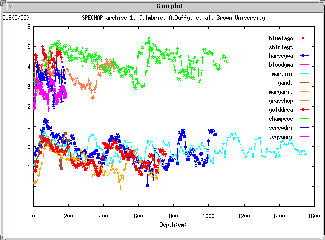
The question is "what is the change in land-cover here?" with answers-large loss, loss, no change, increase, and large increase. The design was seeded from examples about casting a fishing line, filling an opaque water bottle, and shaving with an electric razor. These examples have an ordered change in some aspect of the sound that enables comparisons of more or less-the duration of "whizzing" of the cast, the pitch change of the water bottle and the "buzziness" of the razor. The examples also have categorical distinctions. A good cast sounds "sweet" and a bad cast sounds "clutzy". The full water bottle is distinctly higher and brighter than the empty one. When shaving one can hear the "hairy" and "smooth" ends of the process as distinctive timbres. These examples were used to design a sound sequence that has two categories, and also allows comparisons of more and less along a scale. The rule-base suggests distinct timbres to represent distinct categories (loss, no change, and increase) and pitch to enable comparison (i.e. increase vs large increase). Personify was used to select a brightness interpolation from a bass clarinet at the (large loss) extreme to a bassoon at the other (large increase) extreme. The midpoint (no change) is a dull sound that is not readily identifiable as either timbre. The ordered levels are represented by five ordered pitches, spaced widely to aid identification, from pitch G2 at (large loss) to pitch E4 at (large increase). The integrated display is a land cover change image in which individual pixels (80x60 meters resolution for Landsat MSS data) can be heard by tapping them with the mouse. The overall and intermediate structure can be seen in color variation. Local queries and point comparisons that are difficult to see may be answered by listening instead. ClimatologyOxygen 18 (O18) isotope levels in sea-bed drill cores correspond with changes in the earth's climate over the past 400,000 years. A typical representation of this data consists of overlaid time-series plots of O18 levels at different drill core sites. This graph shows overall trends, groupings, and patterns in the data that are useful in modeling the climate over time across a geographic region. However, it can be difficult to follow a single record through the spaghetti of plots, or track relationships between records. Sounds may help the analyst to track a site through the mix, and improve the perception of local and intermediate structure. The question is "what is the 018 level at site X (any 1 of 15 sites) at this depth ?" with answers low, medium, high.The design was seeded from examples about bicycling in traffic, searching for an air rescue beacon, and the cocktail party effect. O18 has no obvious auditory semantics, so the cocktail party was chosen as a clich� that may be widely understood. The conscious selection of sounds in a mixture requires the design of cohesive auditory streams. Similarity, proximity, appropriateness, and familiarity are gestalt heuristics used to explain streaming effects. Voice timbre and spatial position can influence stream segregation. Fifteen different human voices speaking different words (the names of cocktails) were sampled and looped, and placed in a spatial audio display. Each voice was assigned to a nominal core site. Loudness can represent ratio relations, and is a weak factor in segregation that may minimise interference between streams. The temperature level at a site is represented by loudness level in a stream. This exploratory design shows that looped voice-samples can be identified and tracked in a mix. The ability to mentally switch between continuous information streams may be useful in human-computer interfaces. If the core sites had recognizable names (rather than numeric codes) they could have been used as labels to improve the directness of the display. Spoken words may be particularly effective for representing large catalogues of nominal data, and would have immediate advantages for novice users.
Summary The TaDa method integrates task analysis, a database of sound examples, a rule-based design aid, and interactive sound design tools. The method focuses on designing an auditory representation to meet information requirements, so the display is useful for a task and true to the data. The design scenario is described as a story and then recast as questions and answers about display elements. A task analysis, information characterisation, and data characterisation are used to analyse information requirements from these keys. The requirements drive the design of the auditory representation. The design process is supported by computer-aided design tools. A case-based tool returns a list of everyday listening experiences from the EarBenders database, ranked by similarity of structure with the requirements specification. These examples provide semantic schemes, and natural organizations of auditory information, which may seed a sound design. A rule-based tool aids the designer by suggesting acoustic relations that most directly represent information relations. These rules are implemented as representation schemes in the Information-Sound Space—for example categorical relations are represented by categorically different timbres. The Personify tool allows the designer to interactively tailor the auditory representation to the range of variation of a display device, and listen to the results. The method and tools were demonstrated in scenarios from mining exploration, resource planning, and climatology. Experience with the multimedia interfaces that were built showed that sounds can provide information that is difficult to obtain visually. Perhaps the most interesting outcomes have been the discovery of unanticipated advantages of the sounds, for example in the Mining Exploration scenario, tapping on the rock strata at an intersection between layers enabled the disambiguation of the front-most surface without the need to change viewpoint. The demonstrations have stimulated discussions at CSIRO about other possible uses of sounds in monitoring traffic, data mining, and software debugging—indicating an appreciation that sounds are not always "noise".
AcknowledgmentsThis work was supported by a Ph..D. scholarship from the CSIRO Division of Information Technology. Thanks to Matthew Hutchins, Simon Kravis, Nadine Ozkan, Graham Reynolds and the ICAD reviewers.
ReferencesBertin, J. (1981). Graphics and Graphic Information Processing, Walter de Gruyter, Berlin.
Author InformationStephen BarrassCSIRO Division of Information Technology PO Box 664, Canberra ACT 2601, Australia stephen.barrass@dit.csiro.au
|
|||||||||||||||||||||||||||||||||||||||||||||||||||||||||||||||||||||||||||